


A new study for the Transportation Research Board of the National Academy of Sciences, Engineering, and Medicine looks at how changes and trends -- in demographics, geographic trends, employment, transportation options, etc. - could affect public transportation ridership. Renaissance Planning just completed our portion of the background research that went into the study. There are some very interesting findings turning up that we thought would be worthy of sharing.
Much of the focus of the study, which is being led by RSG with technical assistance from our own Richard Kuzmyak, looks at how millennials may be different from other age groups and what that may mean for future transit use. Either directly, because millennials are less likely to use cars and many are opting to live in active urban environments, or indirectly because employers see them as the “talented class” and are themselves trending back to cities to capture that resource.
How Overall Trends Have Impacted Transit Use

Source: US Census Bureau, Commuting in America IV Brief 4
Land use and geography are critical factors in performance and use of transit. And these trends haven’t been favorable to transit.
Beginning in the 50’s and 60’s, there has been a migration of people and jobs from center cities to suburbs, with the highest rates in the Sunbelt and the Southwest U.S. Most population growth since 1950 has occurred in metropolitan areas (85% of all population in 2010 as compared to approximately 50% in 1950) and suburban areas account for the majority of the population growth in metropolitan areas (62% of total metropolitan population in 2010, as opposed to approximately 25% in 1950).
“Areas outside city centers, developed after the invention of the automobile, have experienced a 36% decline in average density (from 8.65 to 5.58 pers/sq mi).
Employment in regional core dropped from 67% in 1950 to 50% in 1963 to 21% in 2006”
Employers have followed a similar geographic trend to population growth within the past sixty years. The earliest to move were manufacturing, retail, service and wholesaling – then white collar/office in 70s & 80s. These moves have been happening in office parks and strip malls, which are hard to serve with transit and not walkable. Since 1960, most commute travel is by private vehicle. Bicycle use has increased slightly, and transit only somewhat since 2000. Working at home is the fastest growing commuting option.

Transit Use by Region and Metro Area
Efficient access to transit at both trip ends is highly critical to usage. These demographic, employment and development patterns have not been conducive to transit and have in fact made it less accessible. Only 50% of households are within ½ mile of a transit stop (41% within ¼ mile), and 60% of jobs are within ½ mile (52% within ¼ mile). The typical job is accessible to only 27% of metropolitan area workers within 90 minutes.
A Change in the Tide?
However, recent trends indicate the rebirth of city centers. Some population groups in particular are shifting back to cities. While suburban growth is still increasing, urban locations are attracting millennials at a faster rate (at least through 2010). The number of college educated adults aged 25-34 living near city centers is 2-to-1 compared to the overall metropolitan area. Retirees and employers are also trading suburban locations for cities.
“Between 2007 and 2011 jobs in cities grew at 0.5%, while declining by 0.1% in suburban areas.”

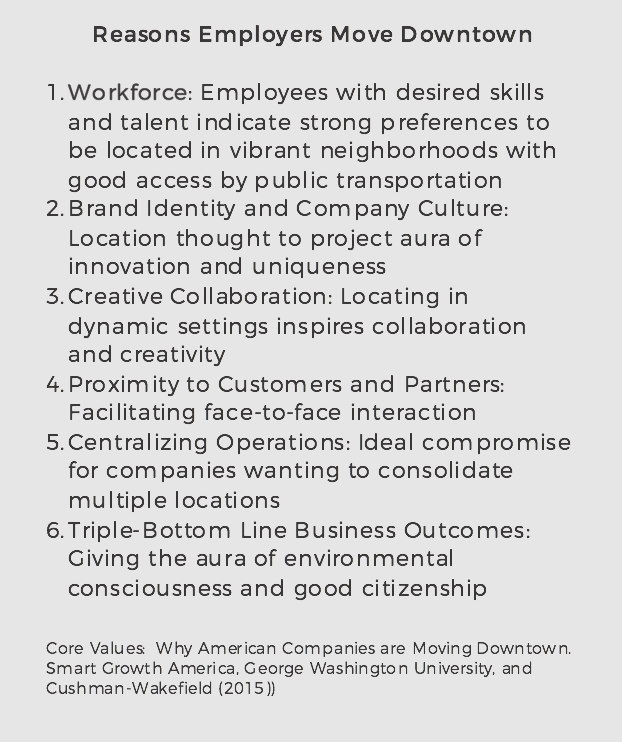
In a study of 500 companies who relocated, opened new offices or expanded in walkable downtowns, professional services, IT, finance and insurance were the top four types of companies moving. The top reasons cited, according to a 2015 study by Smart Growth America, GW University and Cushman-Wakefield, include finding the right talent, creative collaboration, brand identity, and company culture.
How Accessibility Can Explain These Trends

Looking at this research through a multimodal accessibility lens helps explain the variations in attitudes and preferences found in our research.
We can calculate accessibility scores such as walk, transit and bike scores and make accurate predictions of travel behavior. These accessibility scores are part of the U.S. Environmental Protection Agency's Smart Location Database (SLD), which is a database we helped build in 2013. The ration of transit to auto accessibility scores indicates transit friendly areas.

Prior Renaissance Research for MWCOG that Shows Linkage between Transit and Auto
The results of a nationwide survey of 3,500 individuals conducted by RSG showed millennials have a strong preference for urban living locations. We pulled information on accessibility scores from the nationwide Smart Location Database (SLD) and in particular, drew upon earlier research we have done that showed a strong relationship between the ratio of transit to auto accessibility to jobs and the likelihood of the person in that location using transit for the trip to work. The data also shows that millennials are much more likely to ride transit, walk or bike, and use car sharing services. Our research shows that the accessibility measure is very robust in explaining these relationships and linkages.
INTERESTED IN READING MORE?
The full study will be published in the fall. For more information, check out the TRB study web page.
Richard Kuzymak also presented an internal tech lunch to our employees discussing in greater detail the project details and findings. We've posted the presentation on SlidesShare for others to view, and it's also viewable below.